Share
Where Did Branded Residences Activity Concentrate in Dubai in H1 2026
Dubai’s branded residence activity concentrated in Meydan, Downtown Dubai, Dubai Creek Harbour, Dubai Maritime City and Dubai Hills Estate during H1 2026. Together, these five communities recorded 2,744 transactions, approximately 59% of the city’s branded residence sales volume, according to Morgan’s International Realty’s H1 2026 Dubai’s Branded Residences Report.
Meydan led by transaction count, recording 1,378 sales. Downtown Dubai ranked second by volume but generated the highest sales value among the five leading communities, at AED 3.41 billion.
The distinction matters. Transaction volume identifies where sales activity was strongest; sales value shows where larger capital commitments accumulated. Neither measure, on its own, establishes capital appreciation, rental performance or future investment returns.
Which Dubai Communities Led Branded Residence Sales in H1 2026
Dubai recorded 4,648 branded residence transactions worth AED 22.21 billion between 1 January and 30 June 2026. The five leading communities by transaction volume were:
| Rank by volume | Community | Transactions | Share of Dubai total | Total sales value |
|---|---|---|---|---|
| 1 | Meydan | 1,378 | 29.6% | AED 3.03 billion |
| 2 | Downtown Dubai | 405 | 8.7% | AED 3.41 billion |
| 3 | Dubai Creek Harbour | 355 | 7.6% | AED 1.04 billion |
| 4 | Dubai Maritime City | 306 | 6.6% | AED 860 million |
| 5 | Dubai Hills Estate | 300 | 6.5% | AED 1.02 billion |
Source: Morgan’s International Realty, H1 2026 Dubai’s Branded Residences Report, “Top Performing Communities.” Market shares are calculated using the report’s citywide total of 4,648 transactions. Values and percentages are rounded.
Collectively, these communities generated approximately AED 9.36 billion, equivalent to 42% of Dubai’s branded residence sales value. Their share of transactions was therefore substantially greater than their share of value, showing that activity and spending were distributed differently across the market.
Meydan Leads Dubai by Branded Residence Transaction Volume
Meydan accounted for almost three in every ten branded residence transactions in Dubai during H1 2026. Its 1,378 transactions placed it well ahead of the other communities in the report’s volume ranking.
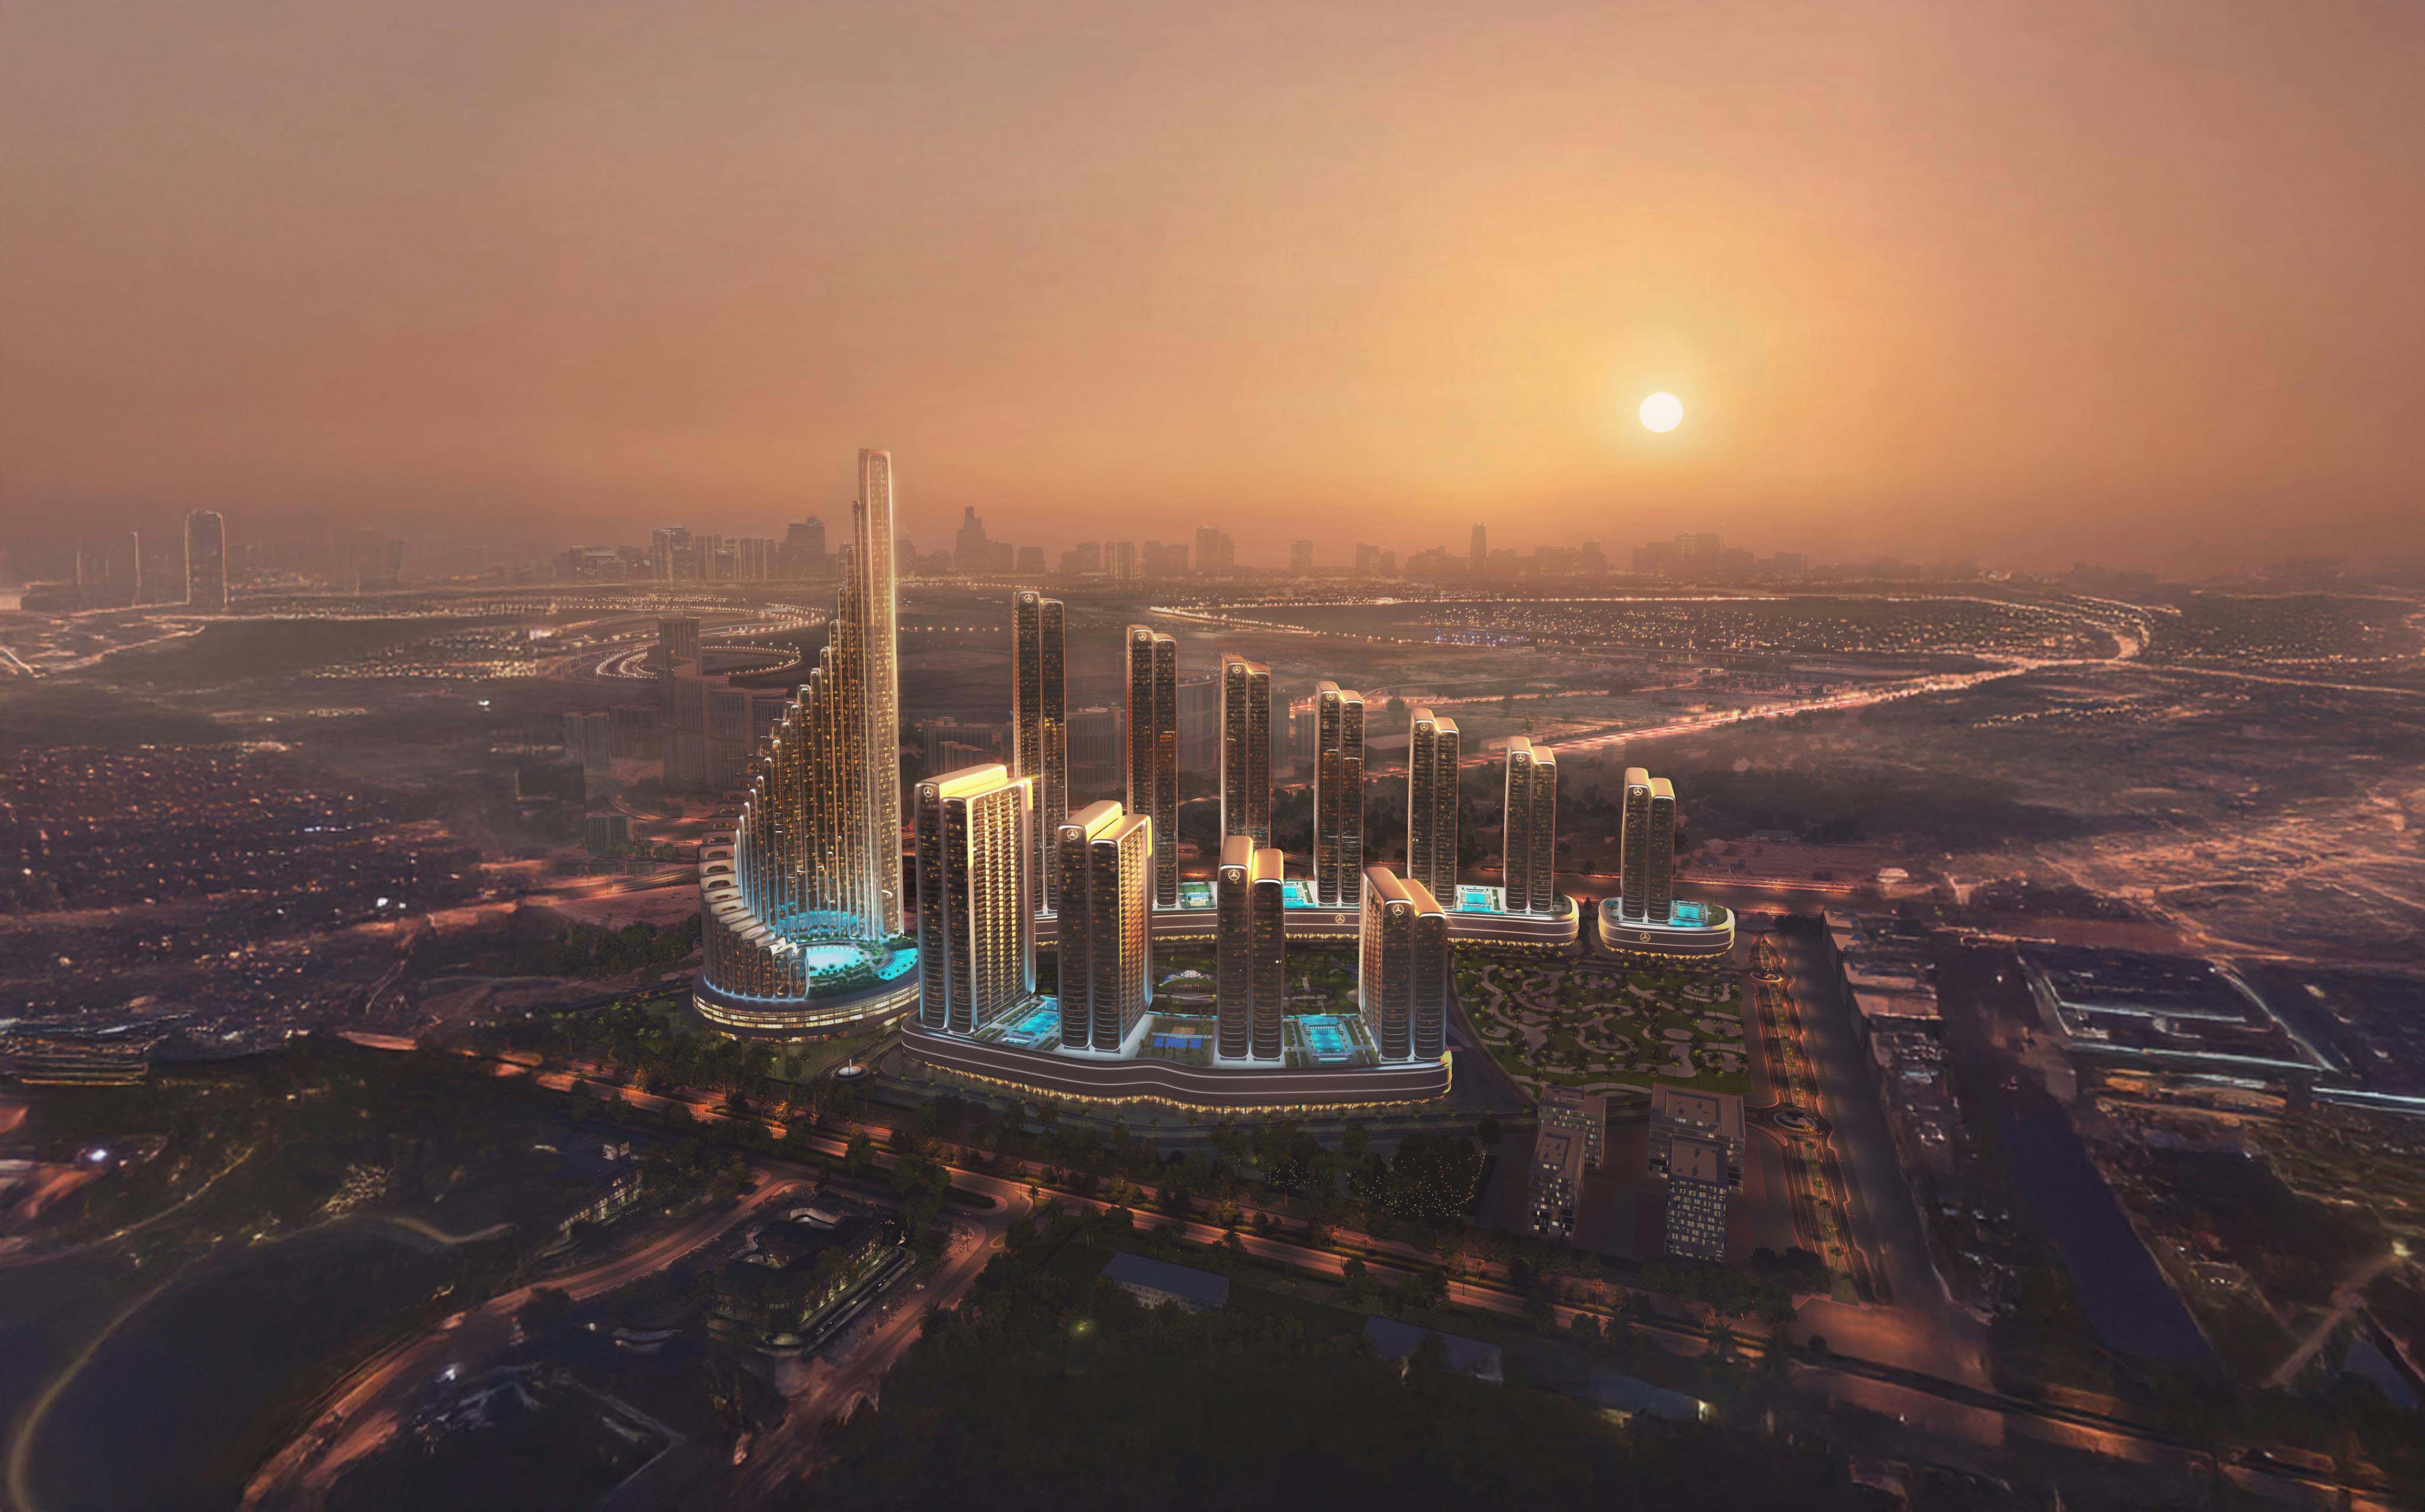
Project-level activity helps explain that lead. Mercedes-Benz Places | Binghatti City recorded 1,216 transactions worth AED 2.11 billion, making it the report’s highest-volume under-construction branded development.
That project’s transaction count was equivalent to approximately 88% of Meydan’s reported community volume and 26% of Dubai’s entire branded residence transaction count.
Binghatti identifies the development with Meydan and Nad Al Sheba, providing context for its position within the wider location.
Meydan’s lead therefore illustrates the influence a major branded launch can have on community rankings. Its transaction volume demonstrates substantial activity, but assessing the breadth of demand requires looking beyond the headline total to the developments contributing to it.
Downtown Dubai Records Higher Sales Value with Fewer Transactions
Downtown Dubai recorded 405 branded residence transactions worth AED 3.41 billion, giving it the highest sales value among the five communities ranked by volume.
Despite recording fewer than one-third of Meydan’s transactions, Downtown generated approximately AED 380 million more in sales value.
Using the report’s rounded totals, the average registered transaction value was approximately AED 8.4 million in Downtown Dubai, compared with AED 2.2 million in Meydan. These figures describe the properties transacted during the period; they are not like-for-like price comparisons.
Downtown also had the largest branded development footprint in the report, with 23 developments. Its ready-market activity included Address Residences Dubai Mall, with 39 transactions worth AED 300 million, and Address Downtown, with 37 transactions worth AED 181 million.
The community’s results highlight the importance of considering transaction size alongside sales frequency. Downtown’s position was particularly significant in capital committed per recorded sale.
Dubai Creek Harbour Ranks Third by Transaction Volume
Dubai Creek Harbour ranked third, recording 355 branded residence transactions worth AED 1.04 billion. It represented approximately 7.6% of Dubai’s branded transaction volume during H1 2026.
Lyvia by Palace was a significant contributor, with 142 transactions worth AED 413 million. Its sales count was equivalent to 40% of the community’s reported branded residence transactions.
The report recorded eight branded developments in Dubai Creek Harbour. Its results show meaningful activity across a community with a smaller branded development footprint than Downtown Dubai.
For readers comparing locations, the useful distinction is between community-level activity and the contribution of individual developments. A strong project can materially influence a location’s overall ranking.
Dubai Maritime City Ranks Fourth by Volume
Dubai Maritime City recorded 306 branded residence transactions worth AED 860 million, placing it fourth by transaction count.
Its 6.6% share of citywide branded transactions put it close to Dubai Hills Estate by volume. However, its total sales value was lower, demonstrating a different mix of transaction sizes.
The report identified four branded developments in Dubai Maritime City. That combination of development footprint and recorded transactions makes the community relevant to an assessment of where branded activity occurred during the period.
The figures establish its position in the H1 ranking. They do not, without comparable historical data, establish whether its market share was increasing.
Dubai Hills Estate Completes the Top Five
Dubai Hills Estate completed the top five with 300 branded residence transactions worth AED 1.02 billion. It accounted for approximately 6.5% of Dubai’s branded transaction volume.
Palace Residences Hillside recorded 179 transactions worth AED 459 million, equivalent to approximately 60% of the community’s reported transaction count.
Dubai Hills Estate had six fewer transactions than Dubai Maritime City but approximately AED 160 million more in sales value. This reinforces the importance of comparing both measures when evaluating community activity.
The report recorded ten branded developments in Dubai Hills Estate, giving it a broader development footprint than Dubai Creek Harbour, Dubai Maritime City or Meydan.
What This Concentration Reveals About Dubai’s Branded Residence Market
The H1 2026 results reveal three important patterns.
Major projects had a substantial influence on community rankings. Mercedes-Benz Places | Binghatti City, Lyvia by Palace and Palace Residences Hillside each contributed materially to activity in their respective locations. Community totals should therefore be read alongside project-level results.
Volume leadership and value leadership were different. Meydan led decisively by transaction count, while Downtown Dubai generated more sales value among the five leading communities. A single ranking cannot fully describe market performance.
The wider market remained predominantly under construction. Across Dubai, under-construction branded residences accounted for 3,790 transactions, approximately 82% of total volume, and 78% of sales value. This provides essential context for understanding the influence of new developments on H1 activity.
The number of branded developments also tells a different story from transaction rankings. Downtown Dubai, Business Bay and Palm Jumeirah had the largest development footprints, with 23, 21 and 18 developments respectively. Having more branded developments did not automatically translate into a top-five position by H1 transaction volume.
Download the full reportFrequently Asked Questions
Related Posts